Audio Waveform Generator — PNG & SVG.
Turn a song, voice recording or podcast into a clean peak-envelope image. Customize the view, preview it in the browser and download a PNG or scalable SVG.
MEASUREMENT MAP
Waveform Image Composer
Turn a signal into evidence you can inspect. A useful analyzer connects the raw trace, the measurement window and a clearly labeled result without pretending that one number explains the whole recording.
Open the full signal breakdownBest source, processing logic, limits and three-pass listening check
- Complete audio track
Start with the right material
Podcast artwork, documentation, episode chapters, social graphics and visual references that need the real shape of a recording.
- Render peak geometry
Understand the transformation
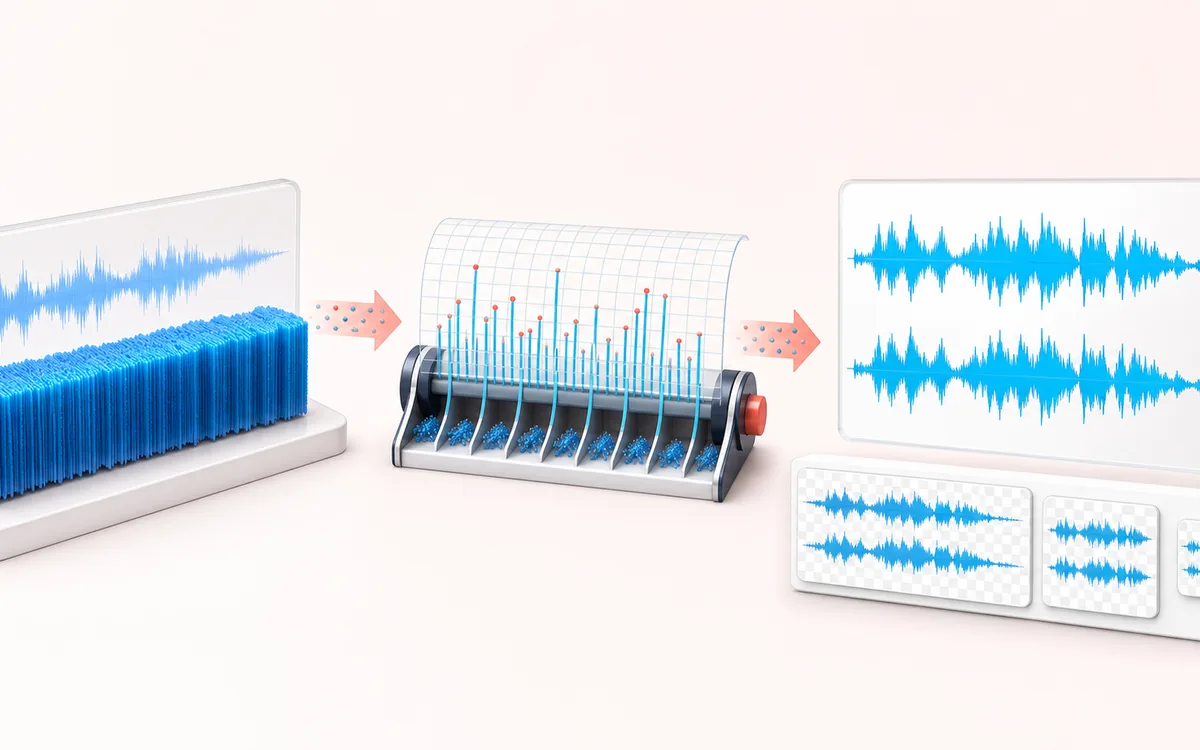
The browser decodes the file, scans sample peaks into output-width bins and draws either a mono mix or separate channel lanes using the selected dimensions, colors and normalization.
- PNG or SVG waveform
Verify the usable result
A configurable preview plus a raster PNG and resolution-independent SVG of the same complete-file waveform.
Where this workflow stops
The image shows peak amplitude over time, not frequency content, LUFS, speech, notes or a mastering-quality score. Browser decoding can resample the source.
Make the final decision by ear
- Use the same window and settings when comparing two files.
- Treat estimates as evidence, not as a substitute for listening.
- Export or note the measurement context alongside the result.
- Input
- Audio formats that your current browser can decode.
- Analysis
- Time-domain minimum and maximum sample peaks grouped across the selected image width.
- Output
- A raster PNG or scalable SVG waveform image generated on your device.
How to create an audio waveform image
- Select an audio file that your browser can decode.
- Choose the image dimensions and available waveform appearance options.
- Check the preview to confirm that the peaks, quiet sections and overall timeline read clearly.
- Download a PNG for a ready-to-publish image or an SVG for resolution-independent editing.
How it works: the browser decodes the audio, divides its timeline into columns and records the minimum and maximum sample value represented by each column. Connecting those extrema creates a peak envelope without sending the selected audio to AudioWrench.
What a waveform image is useful for
- Podcast and voice layouts: add a recognizable audio timeline to episode art, show notes or transcript graphics.
- Music promotion: make a waveform element for a track card, teaser, cover concept or social post.
- Editing reference: see broad structure, silence, dense sections and prominent transients before opening a full editor.
- Documentation and teaching: illustrate changes in sample amplitude over time with a portable image.
PNG, SVG and waveform options
- PNG
- A fixed-size pixel image for websites, presentations, documents and social graphics.
- SVG
- A vector waveform that can scale without pixelation and remain editable in compatible software.
- Dimensions
- Image width controls how finely the timeline is summarized; height controls the available vertical drawing space.
- Appearance
- Use the available waveform and background controls to fit light, dark or branded layouts.
Interpretation: this is a time-domain peak-envelope image. It does not reveal which frequencies are present like a spectrogram, and it does not calculate perceived loudness or integrated LUFS like a loudness analyzer.
Browser limits: codec support varies across browsers. Decoding can resample audio to the browser audio context rate, and long files need enough memory for the decoded signal. The result represents decoded samples, not the exact byte structure of the source file.
Audio Waveform Generator: quick answer and technical limits
Quick answer: A local sound-wave image maker that reduces decoded audio into a full-file min/max peak envelope for PNG or SVG export.
- Best for
- Podcast artwork, documentation, episode chapters, social graphics and visual references that need the real shape of a recording.
- How it works
- The browser decodes the file, scans sample peaks into output-width bins and draws either a mono mix or separate channel lanes using the selected dimensions, colors and normalization.
- What you get
- A configurable preview plus a raster PNG and resolution-independent SVG of the same complete-file waveform.
Know before you use it: The image shows peak amplitude over time, not frequency content, LUFS, speech, notes or a mastering-quality score. Browser decoding can resample the source.
Privacy: Selected audio is processed in this browser and is not uploaded to AudioWrench. Normal page assets can still be requested as described in the privacy notice. Privacy details →