Online Audio Spectrogram & Frequency Spectrum Analyzer.
Use this audio spectrum analyzer online for a live frequency curve, scrolling spectrogram or bounded sampled file peak timeline — with local PNG, CSV and JSON exports.
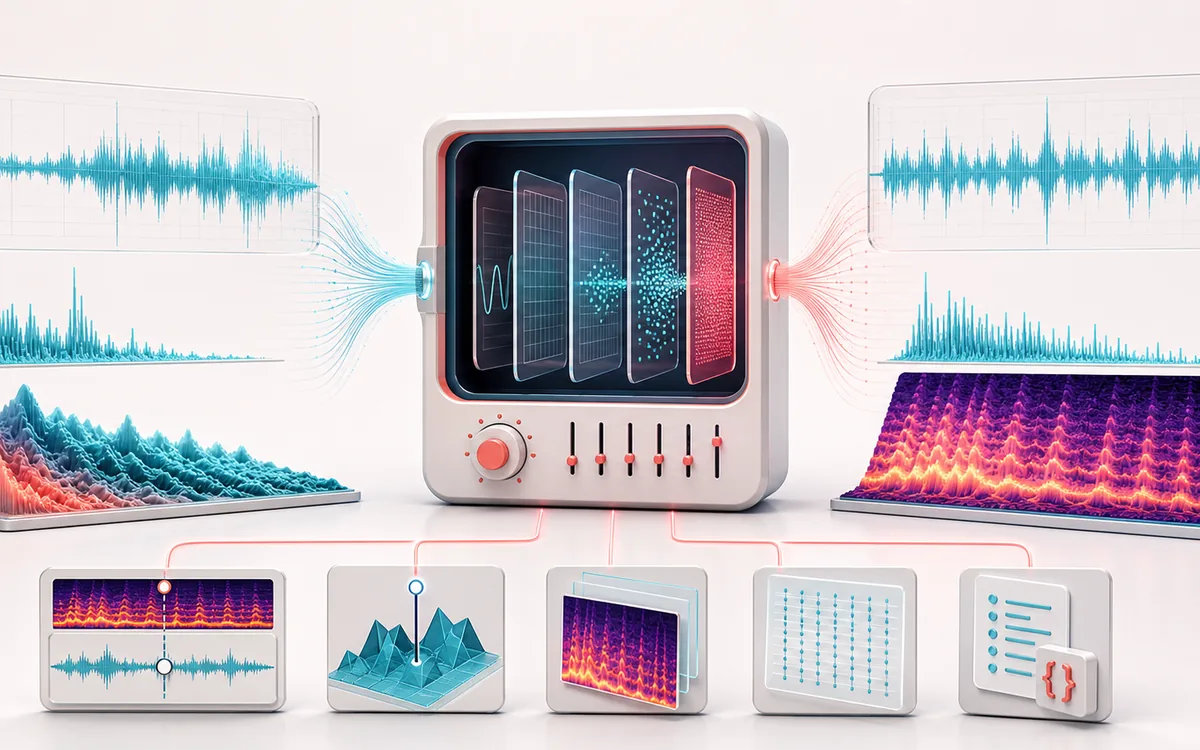
SPECTRAL MAP
Frequency Heatmap
See where tone changes across the frequency range. Read the curve from low to high frequency, then connect every visible move to something you can actually hear in the source.
Open the full signal breakdownBest source, processing logic, limits and three-pass listening check
- Audio or live signal
Start with the right material
Learning, sound-design inspection, locating dominant tones over time, spotting broad noise bands and exporting reproducible frequency evidence.
- Transform time to frequency
Understand the transformation
Live mode reads Web Audio analyser bins; the bounded file scan runs a Hann-windowed FFT per channel, combines channel power, and samples at most 720 windows across the timeline with explicit hop and resolution settings.
- Spectrogram export
Verify the usable result
Live readouts, cursor inspection, a bounded sampled overview PNG, a visible frequency timeline, CSV data and a JSON receipt containing FFT method, global bands and exact audio dimensions.
Where this workflow stops
Levels are relative dBFS, not calibrated sound-pressure level. This is an audio-frequency analyzer, not an optical, chemical or medical spectrometer; results depend on decoding, sample rate, FFT size, window and channel mixing.
Make the final decision by ear
- Sweep or solo only to locate a problem; make the final decision in context.
- Watch broad tonal balance as well as narrow resonances.
- Recheck level after any boost so the comparison stays honest.
- Input
- Microphone or browser-decodable audio file up to 200 MB.
- Analysis
- 1024–8192-sample Hann FFTs; bounded file scans sample at most 720 responsive analysis frames.
- Output
- Live PNG, bounded sampled file overview PNG, peak-frequency timeline CSV and JSON receipt with exact method parameters.
Audio spectrum vs spectrogram: which view should you use?
An audio spectrum plots frequency against relative level for the current instant, which is useful for checking a dominant pitch, hum or harmonic balance. A spectrogram adds time: each FFT frame becomes a vertical slice, so you can see when a tone, transient, hiss band or voice component appears. The bounded file scan samples up to 720 windows across the timeline and turns each sampled frame's strongest peak into a readable table and portable evidence files.
Some people call this kind of page an online spectrometer. That wording is reasonable only for audio-frequency inspection: this tool analyzes decoded sound and microphone input. It does not measure light wavelengths, radio-frequency emissions, chemical samples or medical signals, and it is not a calibrated optical, RF or clinical spectrometer.
How to use the audio frequency analyzer
- Drop an audio file to play it through the analyzer, or press “Use microphone” for live input.
- Watch the scrolling spectrogram or spectrum while the peak-frequency and relative-dBFS cards update.
- Move the cursor over the canvas to inspect time/frequency, then tune FFT size, colour intensity and frequency scale.
- Press “Analyze sampled file” to build the bounded peak timeline, then export the overview PNG, row-level CSV or reproducible JSON receipt.
Reproducible method: live mode uses a Web Audio AnalyserNode. The bounded file scan applies a Hann window and 1024, 2048, 4096 or 8192-sample FFT to each channel, then aggregates mean power so opposite-phase stereo does not cancel. The receipt records the exact FFT size, constant hop in samples and seconds, frequency-bin resolution, window formula/coherent gain, linear or logarithmic display scale, duration, rate, channels and global peaks. The scan samples at most 720 frames and yields regularly so progress and cancel stay responsive.
Level and browser limits: dBFS is level relative to digital full scale, not calibrated SPL. Frequency resolution is sample rate ÷ FFT size; a larger FFT separates closer tones but spans more time. Results can vary with browser decoding, resampling, microphone hardware and room acoustics. The decoded-PCM guard refuses jobs estimated above 256 MiB or eight channels, while the input decoder separately caps source files at 200 MB.
Spectrogram Analyzer: quick answer and technical limits
Quick answer: An audio spectrum analyzer online with live spectrum and scrolling spectrogram views plus a bounded sampled file peak-frequency timeline.
- Best for
- Learning, sound-design inspection, locating dominant tones over time, spotting broad noise bands and exporting reproducible frequency evidence.
- How it works
- Live mode reads Web Audio analyser bins; the bounded file scan runs Hann-windowed FFTs per channel, aggregates mean power, and samples at most 720 timeline frames with explicit hop and resolution settings.
- What you get
- Live readouts, cursor inspection, a bounded sampled overview PNG, a visible frequency timeline, CSV data and a JSON receipt containing FFT method, global bands and exact audio dimensions.
Know before you use it: Levels are relative dBFS, not calibrated sound-pressure level. This is an audio-frequency analyzer, not an optical, chemical or medical spectrometer; results depend on decoding, sample rate, FFT size, window and channel aggregation.
Public browser workflow evidence
Question: Can the analyser load a local audio fixture, draw its spectrum and export a readable PNG?
Observed result: The six-second fixture loaded and the visible spectrogram exported as a valid 10,037-byte PNG.
Evidence boundary: This published case covers the live analyser viewport. The separate full-file mode has a targeted regression test, but neither mode is a calibrated laboratory spectrometer or SPL meter.
Network observation: No audio-payload or cross-origin requests were observed during this published workflow.
Privacy: Selected audio is processed in this browser and is not uploaded to AudioWrench. Normal page assets can still be requested as described in the privacy notice. Privacy details →