Online Audio Oscilloscope
Inspect a short moving window of actual audio samples from a file or microphone. Stabilize repeating tones with a trigger, measure time and amplitude with cursors, estimate period and frequency, then freeze and save the scope screen.
MEASUREMENT MAP
Triggered Wave Scope
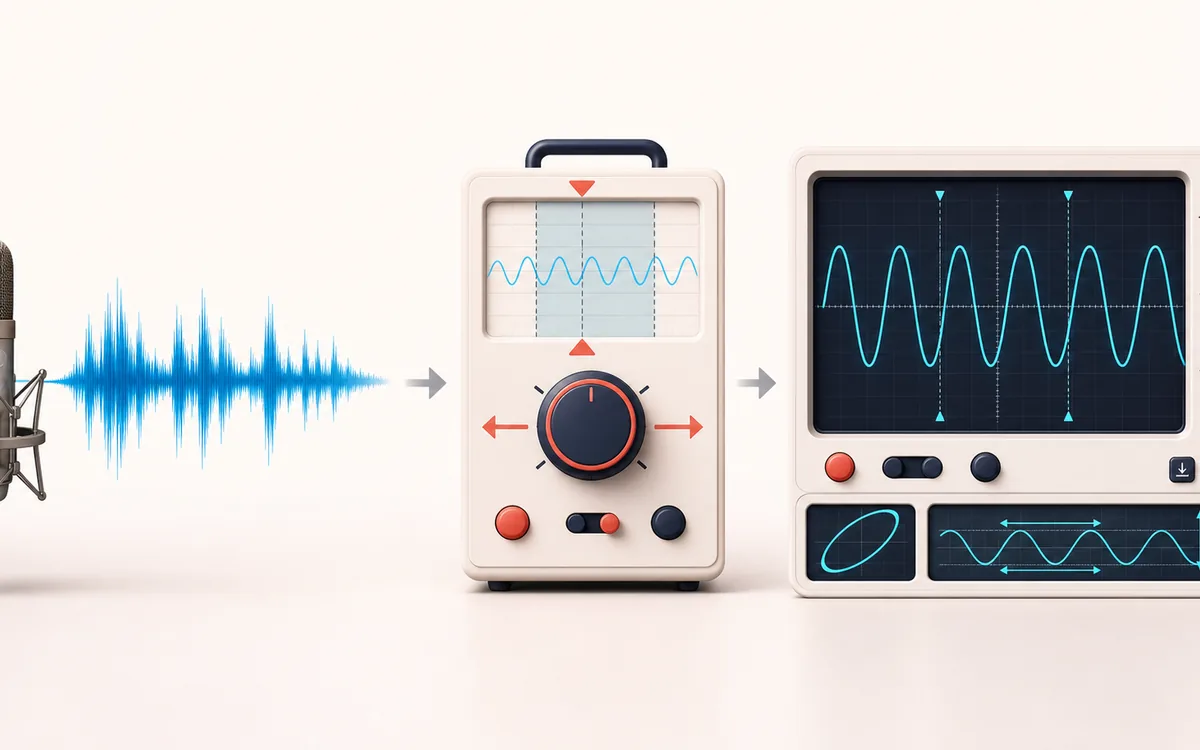
Turn a signal into evidence you can inspect. A useful analyzer connects the raw trace, the measurement window and a clearly labeled result without pretending that one number explains the whole recording.
Open the full signal breakdownBest source, processing logic, limits and three-pass listening check
- Mic file or tone
Start with the right material
Inspecting waveform shape, periodic signals, polarity, clipping-like flattening and timing details that are hidden in a full-track overview.
- Stabilize waveform view
Understand the transformation
A bounded sample window is selected around the requested trigger crossing and drawn against time and amplitude axes while playback or microphone capture remains local.
- Scope snapshot
Verify the usable result
A live or frozen trace with cursor measurements, a frequency estimate for stable periodic signals and a downloadable PNG snapshot.
Where this workflow stops
This browser display is not a calibrated laboratory oscilloscope. Frequency estimates need a stable periodic signal, and microphone results depend on the device and input processing.
Make the final decision by ear
- Use the same window and settings when comparing two files.
- Treat estimates as evidence, not as a substitute for listening.
- Export or note the measurement context alongside the result.
How to use the online audio oscilloscope
- Choose a source. Load browser-decodable audio, generate the deterministic 440 Hz test tone or explicitly allow microphone access.
- Start the scope. Choose L, R or Mix, then set milliseconds per division and normalized amplitude per division.
- Stabilize and measure. Move the trigger level and choose a rising or falling edge. Click twice on the screen for A/B time-amplitude cursors and a Δt/Δamplitude reading.
- Freeze and save. Freeze holds the current display while file audio continues; Stop ends playback or closes microphone tracks. Download PNG saves the full canvas, grid, trigger and cursors.
Oscilloscope versus full-file waveform and spectrogram
- Online Audio Oscilloscope
- Plots individual time-domain samples across a short live window. Use trigger, scale and cursors to inspect cycles, polarity, clipping shape, DC offset and transient edges.
- Waveform Generator
- Scans the complete decoded file and compresses its minimum/maximum peaks into a publishable whole-track PNG or SVG. It does not show individual live cycles.
- Spectrogram
- Uses FFT frequency bins to show spectral energy over time. It is better for harmonics and noise bands; this oscilloscope stays in the time domain.
Trigger, cursors and frequency estimate
A rising trigger looks for a sample crossing from below the selected level to at or above it; falling does the opposite. When found, that crossing is placed at the fixed yellow trigger-time line, making a repeating waveform appear stable. If no qualifying crossing exists in the available window, the screen continues without claiming a lock.
The tone estimate removes DC offset, finds interpolated rising mean crossings and averages their periods. It needs several clean cycles, so noise, polyphonic audio, clipping or too narrow a timebase can make the estimate unavailable or approximate. Cursor amplitude is a normalized digital sample value, not volts or calibrated SPL.
Microphone privacy and practical limits
Microphone mode begins only after a user click and browser permission. Echo cancellation, noise suppression and automatic gain control are requested off so the displayed shape is closer to the raw input, although browser and hardware behavior can vary. The microphone graph is not connected to speaker output, preventing feedback, and Stop closes every active media track.
Selected files are capped before decoding, then checked for mono/stereo channel count and a device-class duration limit. The live window is capped at 32,768 samples, so changing timebase does not allocate an unbounded analysis buffer. Loading a new source invalidates stale decode and animation work.
Online Audio Oscilloscope: quick answer and technical limits
Quick answer: An interactive time-domain oscilloscope for a microphone, uploaded file or generated reference tone, with trigger, timebase, channel and cursor controls.
- Best for
- Inspecting waveform shape, periodic signals, polarity, clipping-like flattening and timing details that are hidden in a full-track overview.
- How it works
- A bounded sample window is selected around the requested trigger crossing and drawn against time and amplitude axes while playback or microphone capture remains local.
- What you get
- A live or frozen trace with cursor measurements, a frequency estimate for stable periodic signals and a downloadable PNG snapshot.
Know before you use it: This browser display is not a calibrated laboratory oscilloscope. Frequency estimates need a stable periodic signal, and microphone results depend on the device and input processing.
Privacy: Selected audio is processed in this browser and is not uploaded to AudioWrench. Normal page assets can still be requested as described in the privacy notice. Privacy details →