Audio File Analyzer & Quality Report.
Drop a track to measure its file facts, digital levels, clipping, silence, DC offset and dominant frequency — then save the results as JSON or CSV.
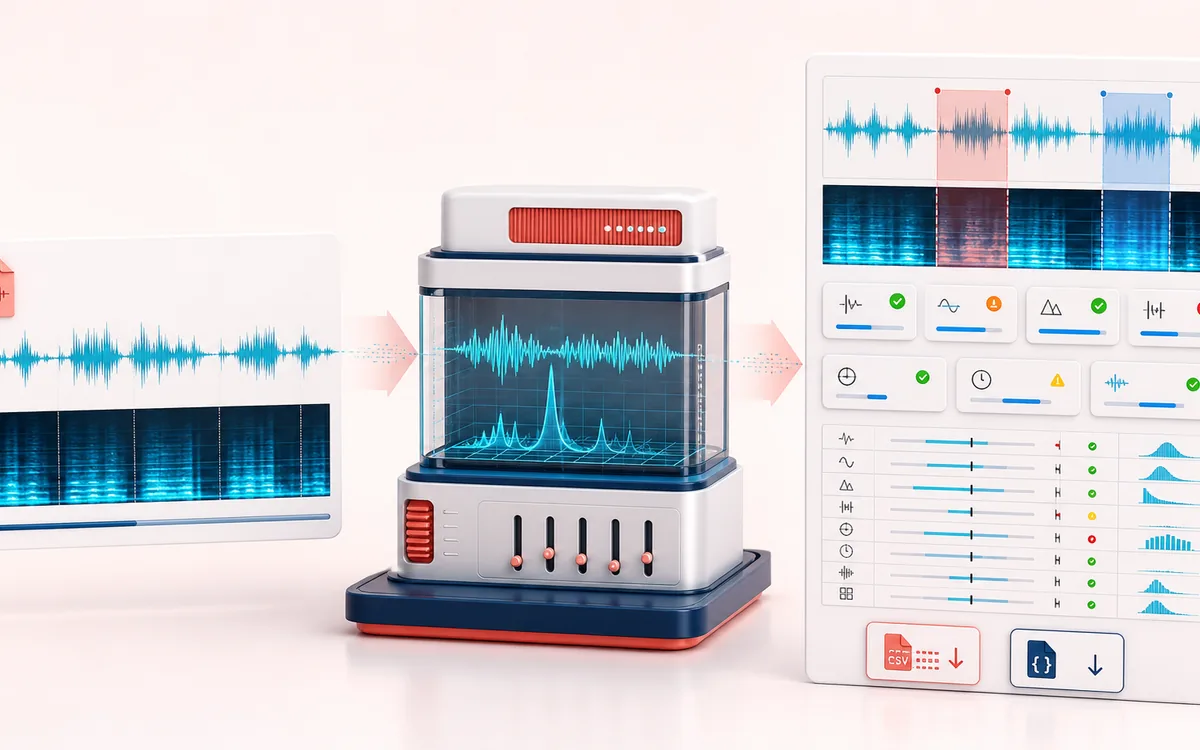
MEASUREMENT MAP
File Health Dashboard
Turn a signal into evidence you can inspect. A useful analyzer connects the raw trace, the measurement window and a clearly labeled result without pretending that one number explains the whole recording.
Open the full signal breakdownBest source, processing logic, limits and three-pass listening check
- Local audio file
Start with the right material
Checking a delivery file, diagnosing clipping or DC offset, comparing level and dynamics, and documenting an audio asset before editing.
- Measure signal facts
Understand the transformation
The browser decodes the selected file, scans PCM samples for peak, RMS, crest factor, clipping, DC offset and time below a stated silence threshold, then estimates one dominant frequency from bounded windows.
- QC report
Verify the usable result
A visible measurement table plus downloadable JSON and CSV reports with values, units and the analysis method.
Where this workflow stops
Browser decoding may resample to the runtime sample rate. The dominant-frequency result is a bounded estimate, silence is threshold-based, and these measurements are not calibrated loudness, codec-quality or forensic tests.
Make the final decision by ear
- Use the same window and settings when comparing two files.
- Treat estimates as evidence, not as a substitute for listening.
- Export or note the measurement context alongside the result.
How to analyze an audio file
- Select a browser-supported audio file up to the standard 200 MB input limit.
- Wait while the browser decodes and scans the PCM samples on this device.
- Review peak and RMS level, crest factor, clipping, silence, DC offset and dominant frequency alongside the decoded file facts.
- Download the complete report as JSON for software or CSV for a spreadsheet.
No invented quality score: the report exposes measurements and their method so you can make the decision. Sample peak is not true peak, RMS is not LUFS, the silence percentage depends on the displayed threshold, and dominant frequency is an estimate from bounded analysis windows.
What the measurements can tell you
- Peak and clipping
- Sample peak shows the largest decoded sample. The clipping counter flags samples at or above the disclosed near-full-scale threshold; it cannot detect every form of analog or codec distortion.
- RMS and crest factor
- RMS summarizes signal energy. Crest factor compares peak with RMS and can help distinguish transient material from a denser signal, without claiming a mastering grade.
- DC offset and silence
- Mean sample value exposes DC bias, while silence is the proportion of scanned sample frames below the report threshold.
- Dominant frequency
- A bounded spectral scan reports the strongest recurring frequency bin. Chords, noise and changing arrangements do not have one definitive frequency.
Audio File Analyzer: quick answer and technical limits
Quick answer: A local audio quality report that measures technical file facts and signal statistics from a decoded track.
- Best for
- Checking a delivery file, diagnosing clipping or DC offset, comparing level and dynamics, and documenting an audio asset before editing.
- How it works
- The browser decodes the selected file, scans PCM samples for peak, RMS, crest factor, clipping, DC offset and time below a stated silence threshold, then estimates one dominant frequency from bounded windows.
- What you get
- A visible measurement table plus downloadable JSON and CSV reports with values, units and the analysis method.
Know before you use it: Browser decoding may resample to the runtime sample rate. The dominant-frequency result is a bounded estimate, silence is threshold-based, and these measurements are not calibrated loudness, codec-quality or forensic tests.
Privacy: Selected audio is processed in this browser and is not uploaded to AudioWrench. Normal page assets can still be requested as described in the privacy notice. Privacy details →