Music Visualizer.
Turn any track — or your microphone — into living, audio-reactive graphics. Pick a style and a palette, go fullscreen, or capture the show as a video.
MEASUREMENT MAP
Reactive Visual Stage
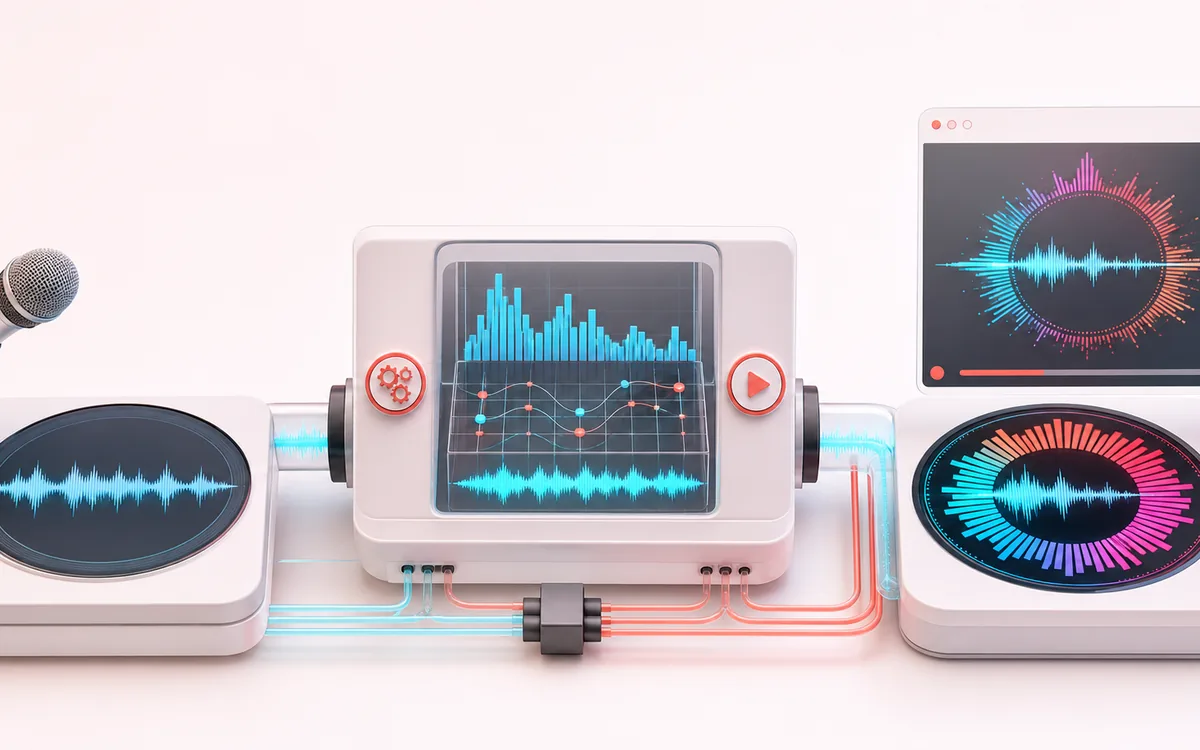
Turn a signal into evidence you can inspect. A useful analyzer connects the raw trace, the measurement window and a clearly labeled result without pretending that one number explains the whole recording.
Open the full signal breakdownBest source, processing logic, limits and three-pass listening check
- Song or microphone
Start with the right material
Reactive backgrounds, music snippets, microphone visuals and quick WebM captures.
- Map sound to motion
Understand the transformation
A Web Audio analyser feeds spectrum and waveform values to the selected real-time canvas effect.
- Rendered visualization
Verify the usable result
A browser preview and real-time WebM recording of the visualization.
Where this workflow stops
It reacts to level and frequency content; it does not detect beats or guarantee beat-perfect synchronization. Recording quality and codec support vary by browser.
Make the final decision by ear
- Use the same window and settings when comparing two files.
- Treat estimates as evidence, not as a substitute for listening.
- Export or note the measurement context alongside the result.
How to visualize music online
- Drop in a track — or switch to the microphone to react to live sound.
- Pick a style (Bars, Mirror Bars, Waveform, Radial Rings, Particles, Spectrogram, Orbit or Tunnel) and a color theme.
- Hit play and watch the canvas move with the music; go fullscreen for a wall-sized show.
- Want a file? Start the video capture, play the track through, stop, and download the .webm with sound.
This music visualizer samples amplitude and frequency data many times per second to drive bars, particles, rings and tunnels. It reacts to changes in the sound, but it does not include a beat detector or guarantee beat-synchronous motion. Eight styles and six palettes can be used for local real-time WebM capture; recording length and smoothness depend on browser and device performance.
Music Visualizer: quick answer and technical limits
Quick answer: A music visualizer that maps live amplitude and frequency energy to eight visual styles and six color themes.
- Best for
- Reactive backgrounds, music snippets, microphone visuals and quick WebM captures.
- How it works
- A Web Audio analyser feeds spectrum and waveform values to the selected real-time canvas effect.
- What you get
- A browser preview and real-time WebM recording of the visualization.
Know before you use it: It reacts to level and frequency content; it does not detect beats or guarantee beat-perfect synchronization. Recording quality and codec support vary by browser.
Privacy: Selected audio is processed in this browser and is not uploaded to AudioWrench. Normal page assets can still be requested as described in the privacy notice. Privacy details →